
Merseyside road casualties
The latest DfT figures for road casualties in Merseyside were released in June 2014, and showed:
- the 2013 pedestrian casualty rate (deaths or serious injuries) was the worst in Great Britain
- the 2013 cyclist total of deaths or serious injuries was at a 20-year high
- 53% of deaths or serious road injuries in Merseyside occurred in pedestrians or cyclists
- there were two child deaths in 2013 - one was a child cyclist and the other a child pedestrian.
The details are as follows.
Cyclists Killed or Seriously Injured
- In 2013, the total for deaths or serious injury (KSI) to cyclists was the highest for at least 20 years. See chart and footnotes (below) for numbers and sources.
- There was one death (a child cyclist)
- The total for child (0 - 15 yrs) cyclist KSIs of 7 was less than the 24 cases of 2012, but still above the national average.
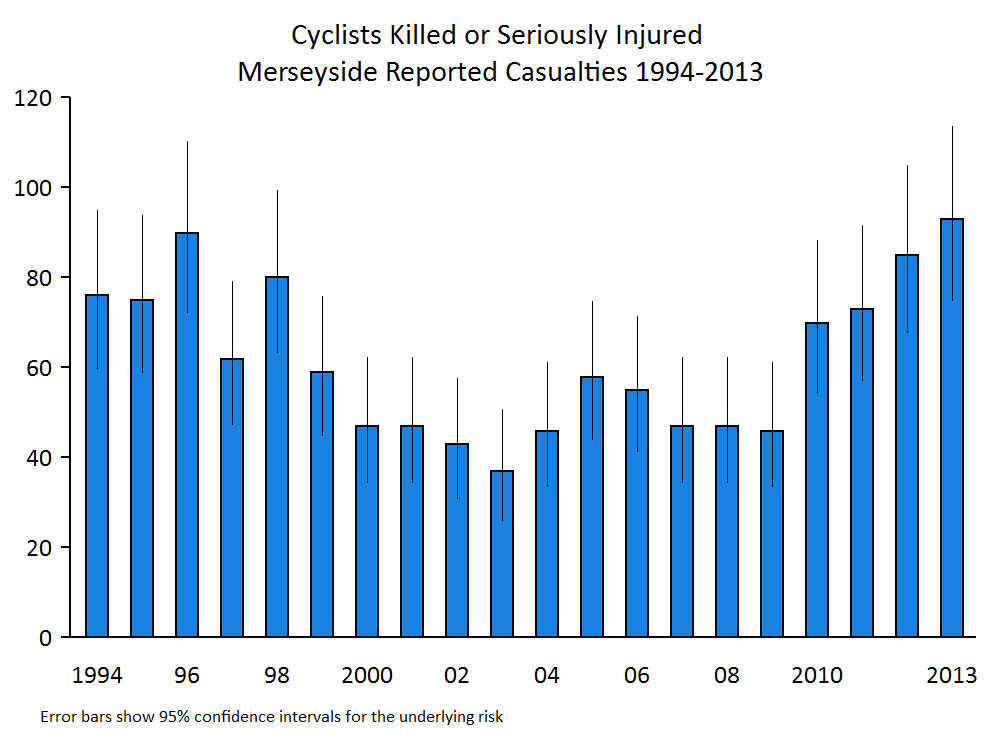
See here for an explanation of confidence intervals.
Proportion of pedestrian and cyclists KSI casualties
- In 2013, 53% of deaths or serious road injuries in Merseyside occurred to pedestrians or cyclists:
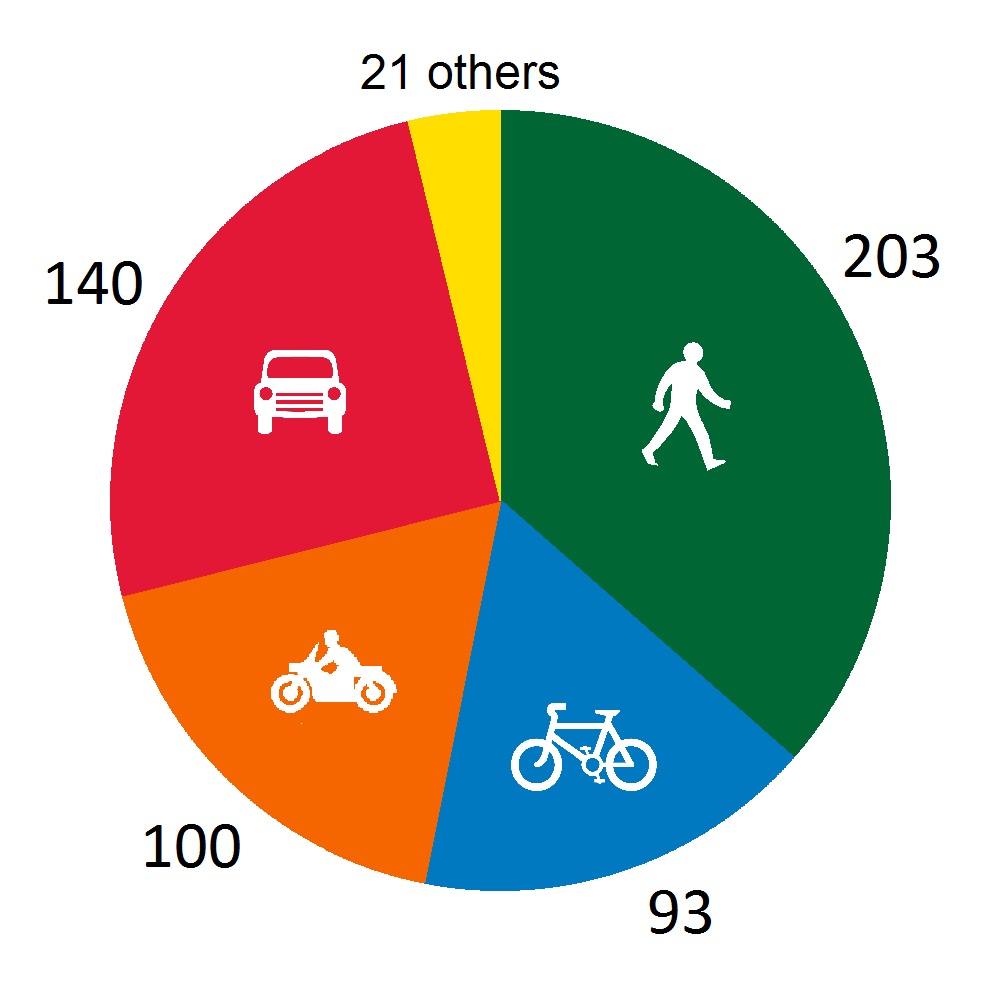
| Year | Pedestrians | Cyclists | Motorcyclists | Car occupants | Others | Total |
|---|---|---|---|---|---|---|
| 2012 | 211 (37%) | 85 (15%) | 89 (16%) | 162 (29%) | 18 (3%) | 565 (100%) |
| 2013 | 203 (36%) | 93 (17%) | 100 (18%) | 140 (25%) | 21 (4%) | 557 (100%) |
Pedestrians (All Ages) Killed or Seriously Injured
In 2013, Merseyside was the worst area in Great Britain for pedestrians reported killed or seriously injured (KSI) casualties per 100,000 population. The rate was 68% above the national average:
Worst five areas in Great Britain (2013)
| Police area | Pedestrian KSI casualties reported | Population (1000s) | Rate per 100,000 population |
|---|---|---|---|
| Merseyside | 203 | 1,353 | 15.0 |
| West Midlands | 347 | 2,655 | 13.1 |
| Lancashire | 183 | 1,449 | 12.6 |
| Sussex | 190 | 1,574 | 12.1 |
| Humberside | 101 | 921 | 11.0 |
| All Great Britain | 5,396 | 60,462 | 8.9 |
This was the third year running that Merseyside was the worst police area in Great Britain for serious/fatal pedestrian casualties.
Child Pedestrians Killed or Seriously Injured
In 2013, Merseyside was the worst police area in Great Britain for child pedestrians killed or seriously injured (KSI) casualties per 100,000 population. The rate was 97% above (i.e. roughly double) the national average:
Worst five police areas in Great Britain (2013)
| Police area | Child pedestrian KSI casualties reported | Child population (1000s) | Rate per 100,000 children |
|---|---|---|---|
| Merseyside | 58 | 243 | 23.8 |
| Durham | 25 | 108 | 23.2 |
| Cleveland | 24 | 108 | 22.3 |
| Humberside | 36 | 163 | 22.0 |
| Lancashire | 56 | 274 | 20.4 |
| All Great Britain | 1,358 | 11,226 | 12.1 |
Footnotes
KSI Cyclist Data for Merseyside:
| Year | All ages | Children (0 - 15 yrs) | Sources |
|---|---|---|---|
| 1994 | 76 | 25 | [1] |
| 1995 | 75 | 27 | [1] |
| 1996 | 90 | 28 | [1] |
| 1997 | 62 | 20 | [1] |
| 1998 | 80 | 32 | [1] |
| 1999 | 59 | 24 | [1] |
| 2000 | 47 | 13 | [1] |
| 2001 | 47 | 13 | [1] |
| 2002 | 43 | 15 | [1] |
| 2003 | 37 | 13 | [1] |
| 2004 | 46 | 16 | [1] |
| 2005 | 58 | 20 | [1] |
| 2006 | 55 | 16 | [1] |
| 2007 | 47 | 15 | [1] |
| 2008 | 47 | 12 | [1] |
| 2009 | 46 | 5 | [1] |
| 2010 | 70 | 13 | [2] |
| 2011 | 73 | 11 | [2] |
| 2012 | 85 | 24 | [2] |
| 2013 | 93 | 7 | [3] |
References:
| [1] | Responses to Freedom of Information requests (2010) https://www.whatdotheyknow.com/user/ian_campbell |
| [2] | Table ras30043 from Reported Road Casualties Great Britain: Annual report 2012 (2013) https://www.gov.uk/government/publications/reported-road-casualties-great-britain-annual-report-2012 or from here: ras30043.xls |
| [3] | DfT road casualty data for English local authorities http://road-collisions.dft.gov.uk/ |